Poverty and Inequality of What? Income, Consumption and Beyond
Income vs Consumption
Up to now we’ve used the term ‘income’, without worrying about what exactly we mean by it, or whether income is really the best thing focus on.
You may well have a reasonable idea of your family’s income. But it’s notoriously difficult to find a definition of income that fits every case, and which can be made operational1. To see the problem, consider Alice and Bob. They have steady jobs on the same monthly salary, so on the face of it the same income, but Bob knows he will come into a large inheritance on retirement and Alice knows she won’t. Clearly, Bob can enjoy a better lifestyle now than Alice, since Alice may have to divert much of her salary into pensions and savings. Likewise, compare Bob, on his steady income, with Cynthia, an Youtube sensation who has made a million this year but who worries about being replaced by the next big thing in a matter of months. In the eyes of the FRS, or indeed the tax authorities, Cynthia is by far the richer. But, if this is her one chance at success, can Cynthia really afford a lavish lifestyle?
This naturally leads to the thought that consumption would a better thing to measure than income. The amount that Alice, Bob, and Cynthia are consuming could be a good indicator of their view of their sustainable, or permanent income. But in practice consumption has problems of its own. Consider durable goods: in any given month, you either buy a fridge or you don’t, and in either case your spending on fridges is a poor indicator of your consumption of the service your fridge provides2. So a comprehensive measure of consumption requires the imputation of some notional ‘rental value’ from all of a household’s durable assets.
Housing is a particular problem in this regard, both for income and consumption measures. For those who own their houses, an ‘imputed rent’ would for many people be the largest element in their income, and, as can be seen from the frequent disputes over house valuations for local taxes, it can be very difficult to agree on what such a rental value should be. Many renters may have little or no choice about how much they pay. It’s hard to tell whether rising rents reflect better quality housing, or simply a situation renters can’t escape from. For these reasons, our official poverty and inequality measures are offered in before- and after- housing cost versions3.
Most studies of the poverty Developing World measure consumption rather than income, for a related but distinct reason - small farmers, sharecroppers and peasants may well consume much of what they produce, only selling some, so any measure of cash income may well understate their wellbeing.
Activity
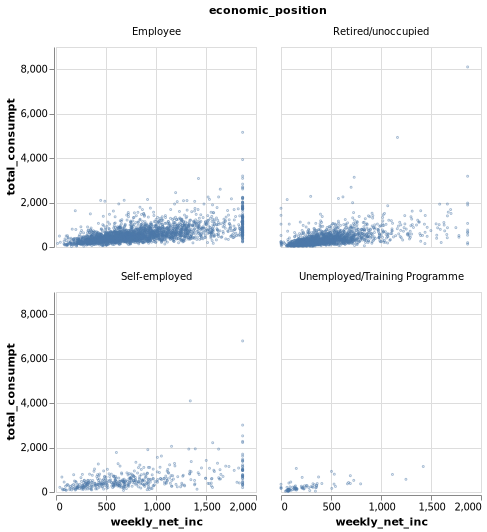
Reopen the LCF subset you used in the Equivalence Scale Activity. As well as the consumption data you explored then, it also contains a weekly income variable (weekly_net_inc). Try exploring the relationship between total spending and income. Are there any interesting patterns you can find?
Answer:
Here are some scatterplots of consumption against income, broken down by the economic position of the household head. There seem to be a number of cases where recorded consumption seems much higher than recorded income. The point above about durables might account for some of this, or perhaps there is under-reporting of some incomes - it’s noticeable that there is a lot of variation for the self-employed, a group I highlighted earlier as having expecially unreliable income data.
Incomes over Time
The differing fates of Alice, Bob and Cynthia highlight the importance of considering the intertemporal nature of income and consumption. There are fewer steady jobs than there were in previous decades, but our surveys are mostly short-term; if they happened to pick Cynthia during her moment of fame she’ll be recorded as very rich, and otherwise as very poor, whereas in reality if she’s sensible she may have a modest but reasonable lifestyle for life. So our surveys be may mistake instability in income for inequality4. With the rise of the ‘Gig Economy’, it’s possible that much of recorded poverty represents people flitting in and out of jobs rather than permanent poverty.
There is another important intertemporal aspect: people likely start out as a net recipient of benefits (such as Child Benefit) and public spending on education and health. As they age, there’s a good chance they become a net contributor through taxation, perhaps with a period as a net recipient if they have a family of their own, before receiving state pensions and perhaps social care towards the end of their life. So, you can view much of the tax-benefit system as adjusting a person’s lifetime income rather than redistributing between groups. To capture this aspect a long-run multi-year model is needed; that’s not what we’re presenting here, but we’ll briefly discuss such a model at the end of this week5.
Broader Indicators of Wellbeing
Instead of single measures such as income or consumption, some advocate multi-dimensional measures. These attempt to condense measures of income, education, health and personal freedom into a single index. Examples of these are the ‘capabilities framework’ of Amartya Sen6, the United Nations Multidimensional Poverty Index7 and, for the UK, the Social Metrics Commission Poverty Index8. These are appealing in some respects: reducing wellbeing to how much you earn, or how much you consume can seem distasteful, and, especially at the levels of countries or regions, it’s certainly possible to have high incomes but poor outcomes for, say, health or education attainment. But there are problems with multidimensional indexes, too: if one aspect improves (health, say) but another worsens (education, perhaps), it’s hard to say definitively that your index has gone up or down. And, although our main datasets have reasonably good data on many of the components of these indexes, in practice it can be very hard to operationalise these measures: as you’ll see, we can predict quite accurately the effects of fiscal changes on incomes or consumption, but predicting the effect on health or education attainment is much harder.
As well as these broad measures, there is sometimes concern about individual aspects; for example fuel poverty9, food poverty10, and recently period poverty11. As with the multidimensional measures, it may be difficult to operationalise these - you might need to augment the model we’re about to look at with a demand system - a model which predicts how consumption of (e.g.) domestic fuel varies with income and prices12.
For all this, in what follows we’ll mostly be talking about changes in incomes, but you should keep these difficulties in mind. We can’t do everything, but that doesn’t mean we should do nothing.
BBC. “Scotland’s ’Period Poverty’ Bill Lodged.” BBC News, April 2019. https://www.bbc.com/news/uk-scotland-scotland-politics-48027903.
Blundell, Richard, and Ian Preston. “Consumption Inequality and Income Uncertainty.” The Quarterly Journal of Economics 113, no. 2 (1998): 603–40. http://www.jstor.org/stable/2586914.
Deaton, Angus. The Analysis of Household Surveys. Washington, DC: World Bank, 2019. https://doi.org/10.1596/978-1-4648-1331-3.
Department for Business, Energy & Industrial Strategy. “Fuel Poverty Trends 2019.” GOV.UK, June 2019. https://www.gov.uk/government/statistics/fuel-poverty-trends-2019.
DWP. “HBAI Documentation, Appendix 2 - Methodology,” 2015. https://assets.publishing.service.gov.uk/government/uploads/system/uploads/attachment_data/file/200775/appendix_2_hbai12.pdf.
Hills, John. Inequality and the State, 2004.
Kay, J. A., M. J. Keen, and C. N. Morris. “Estimating Consumption from Expenditure Data.” Journal of Public Economics 23, no. 1 (1984): 169–81. https://doi.org/https://doi.org/10.1016/0047-2727(84)90071-9.
Meade, James. The Structure and Reform of Direct Taxation (the Meade Report). Allen; Unwin, 1978. https://www.ifs.org.uk/docs/meade.pdf.
Programme, United Nations Development. “The 2019 Global Multidimensional Poverty Index (MPI) Human Development Reports,” 2019. http://hdr.undp.org/en/2019-MPI.
Scotland, NHS. “Food Poverty,” April 2019. http://www.healthscotland.scot/health-inequalities/fundamental-causes/poverty/food-poverty.
Sen, Amartya. Commodities and Capabilities. 3rd ed. New Delhi: Oxford University Press India, 1999.